Visualizing the data
The application can be used to work with a single channel signal or a multichannel signal.
Single channel
When working with only one signal.
Removing DC Component
- To remove the DC component from the signal, under the Channels tab, right-click on the signal name for which you want to remove DC, and click on Remove DC.
Viewing the Power Spectral Density
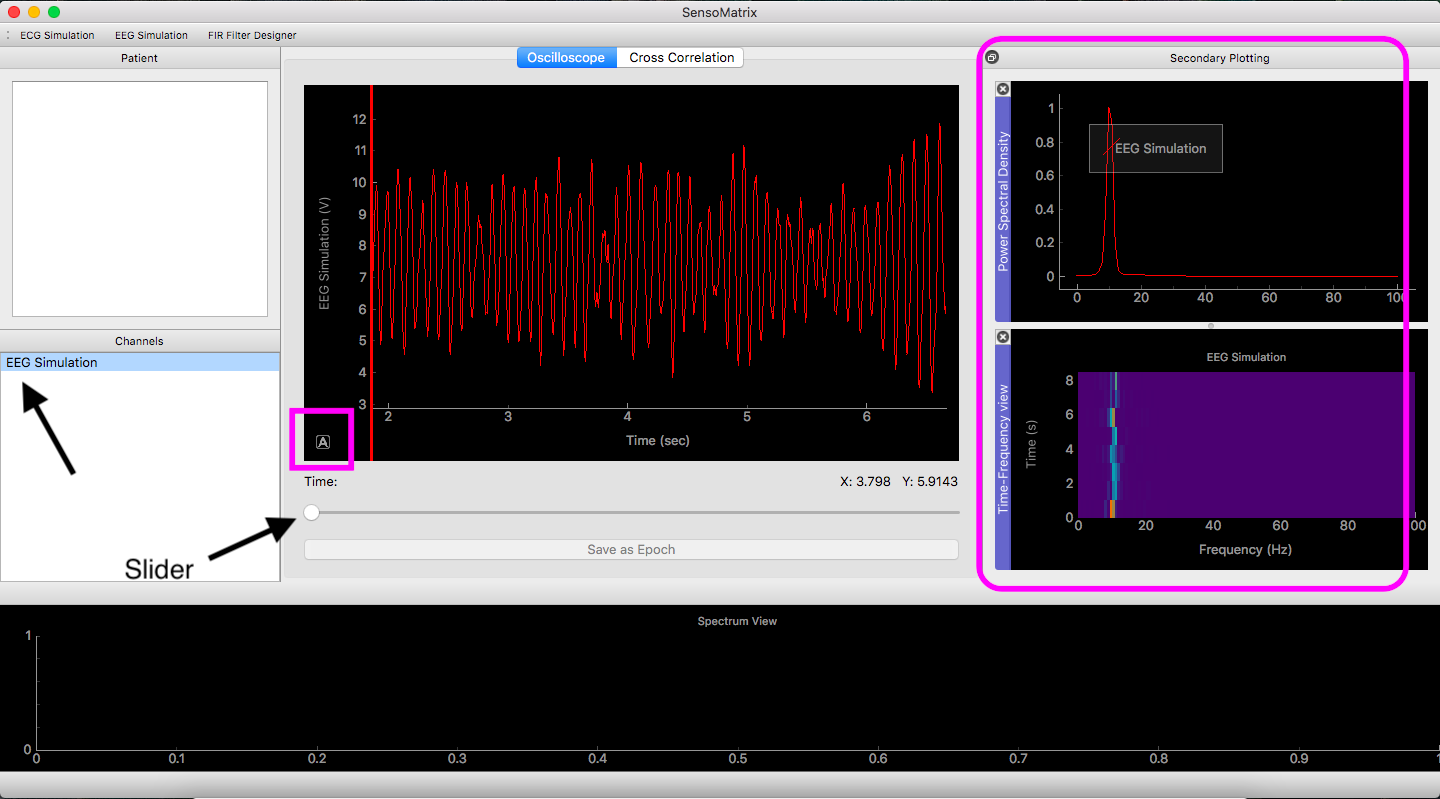
- Under the Channels tab, right-click on the signal name for which you want to see the power spectral density (PSD).
- Click on Plot PSD and the PSD of the signal will appear under the Secondary plotting tab.
Viewing the Time-Frequency Plot
- Under the Channels tab, right-click on the signal name for which you want to see the time-frequency plot.
- Click on Plot Time-Frequency and the time-frequency plot will appear under the Secondary plotting tab.
Moving & Zooming
- To move the signal, click and drag the signal.
- To zoom in & out of the signal, scroll up & down on the signal.
Using the slider
The slider at the bottom of the Oscilloscope can be used to take a
closer look at the signal. In order to see the complete signal again,
hover your mouse over the bottom left corner of the axis (shown in blue
in the image below) and when a small A appears, click on it.
Multichannel
When for example, one file has more than one signal, then each of the following can be done on each signal separately (except the slider and Moving & Zooming, which moves all signals together).
Removing DC Component
Follow the same steps as under single channel.
Viewing the Power Spectral Density
Follow the same steps as under single channel.
Viewing the Time-Frequency Plot
Follow the same steps as under single channel.
Using the slider
Follow the same steps as under single channel.