Tagging a window
In this scenario, the user is able to select a specific time frame (window) from the ECG/EEG signal, in order to perform further analysis.
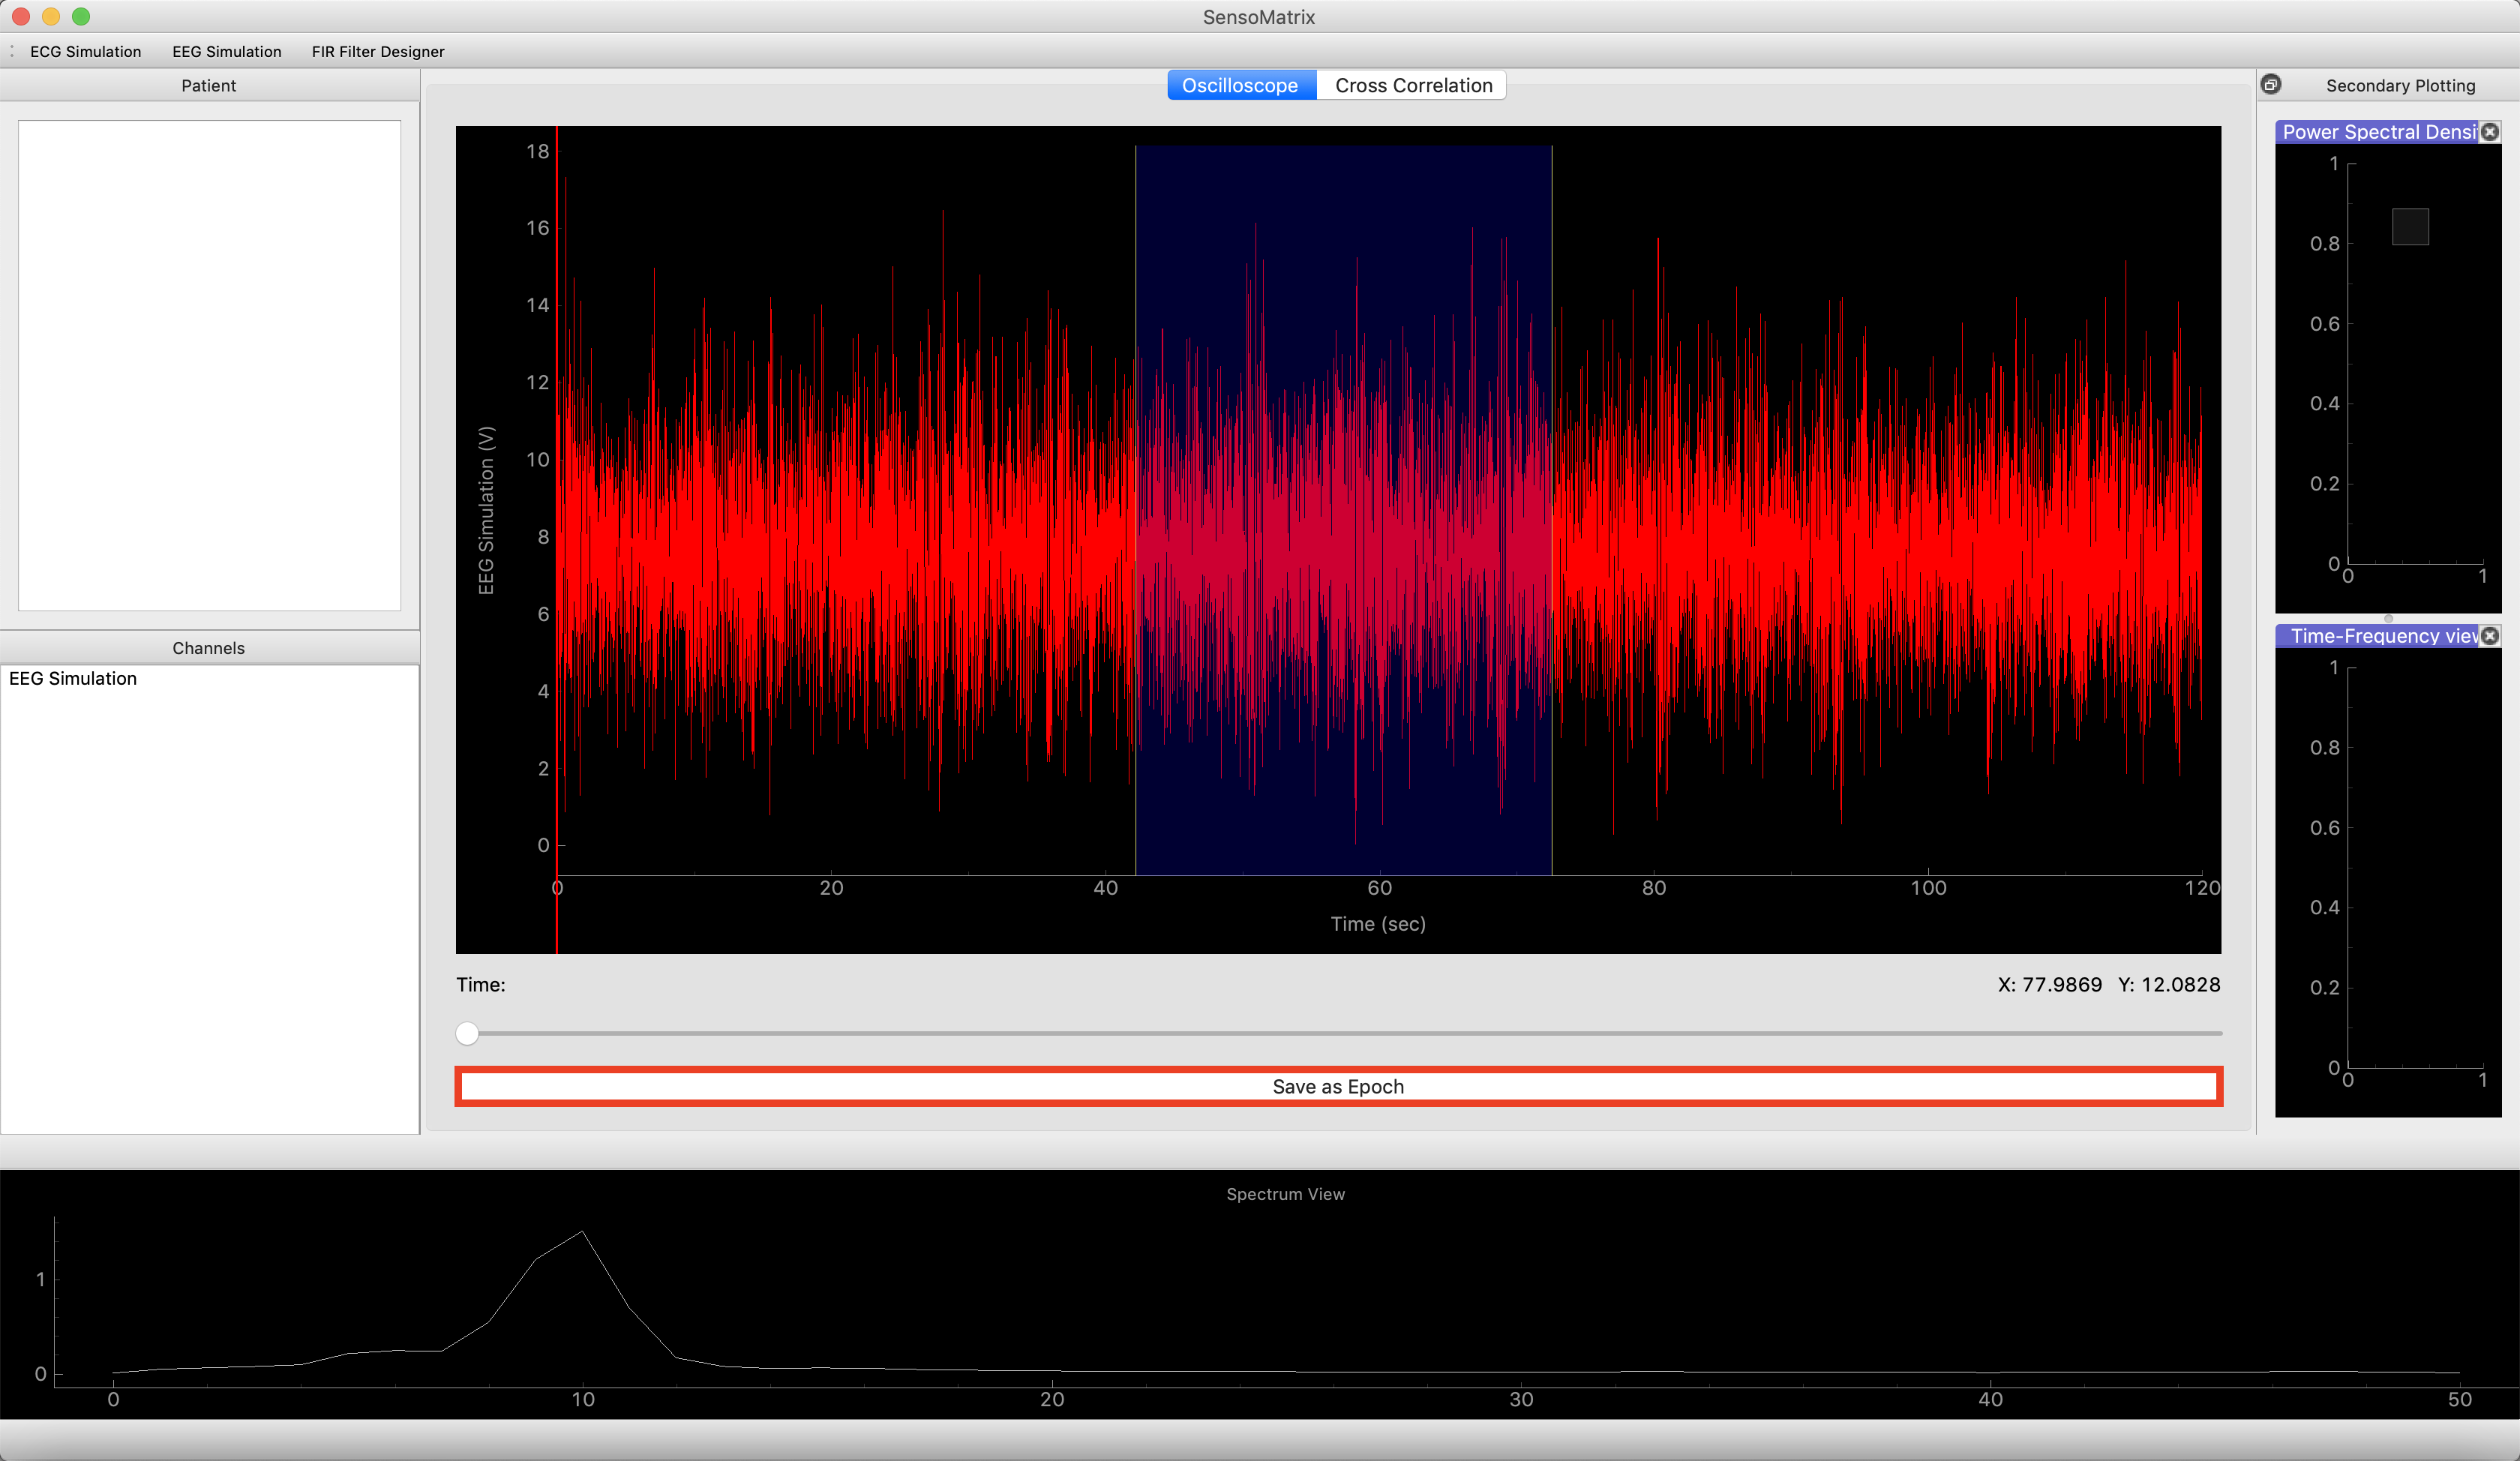
- From the generated/received signal, the user must double click on a
desired portion of the signal, for which he/she can properly analyze
that portion of the signal. Once the desired portion has been
double-clicked for further study, the user will see a blue highlight,
to demonstrate the tagged window. Screenshot provided below:

- The user may also expand or compress the tagged window size, by
simply clicking and holding the edge of the window and dragging it
along the time axis. Screenshot provided below:

- The user may also move the tagged window along the time axis, in order to properly analyze the signal in different periods. This can be done by clicking on the tagged window and moving along the time axis.
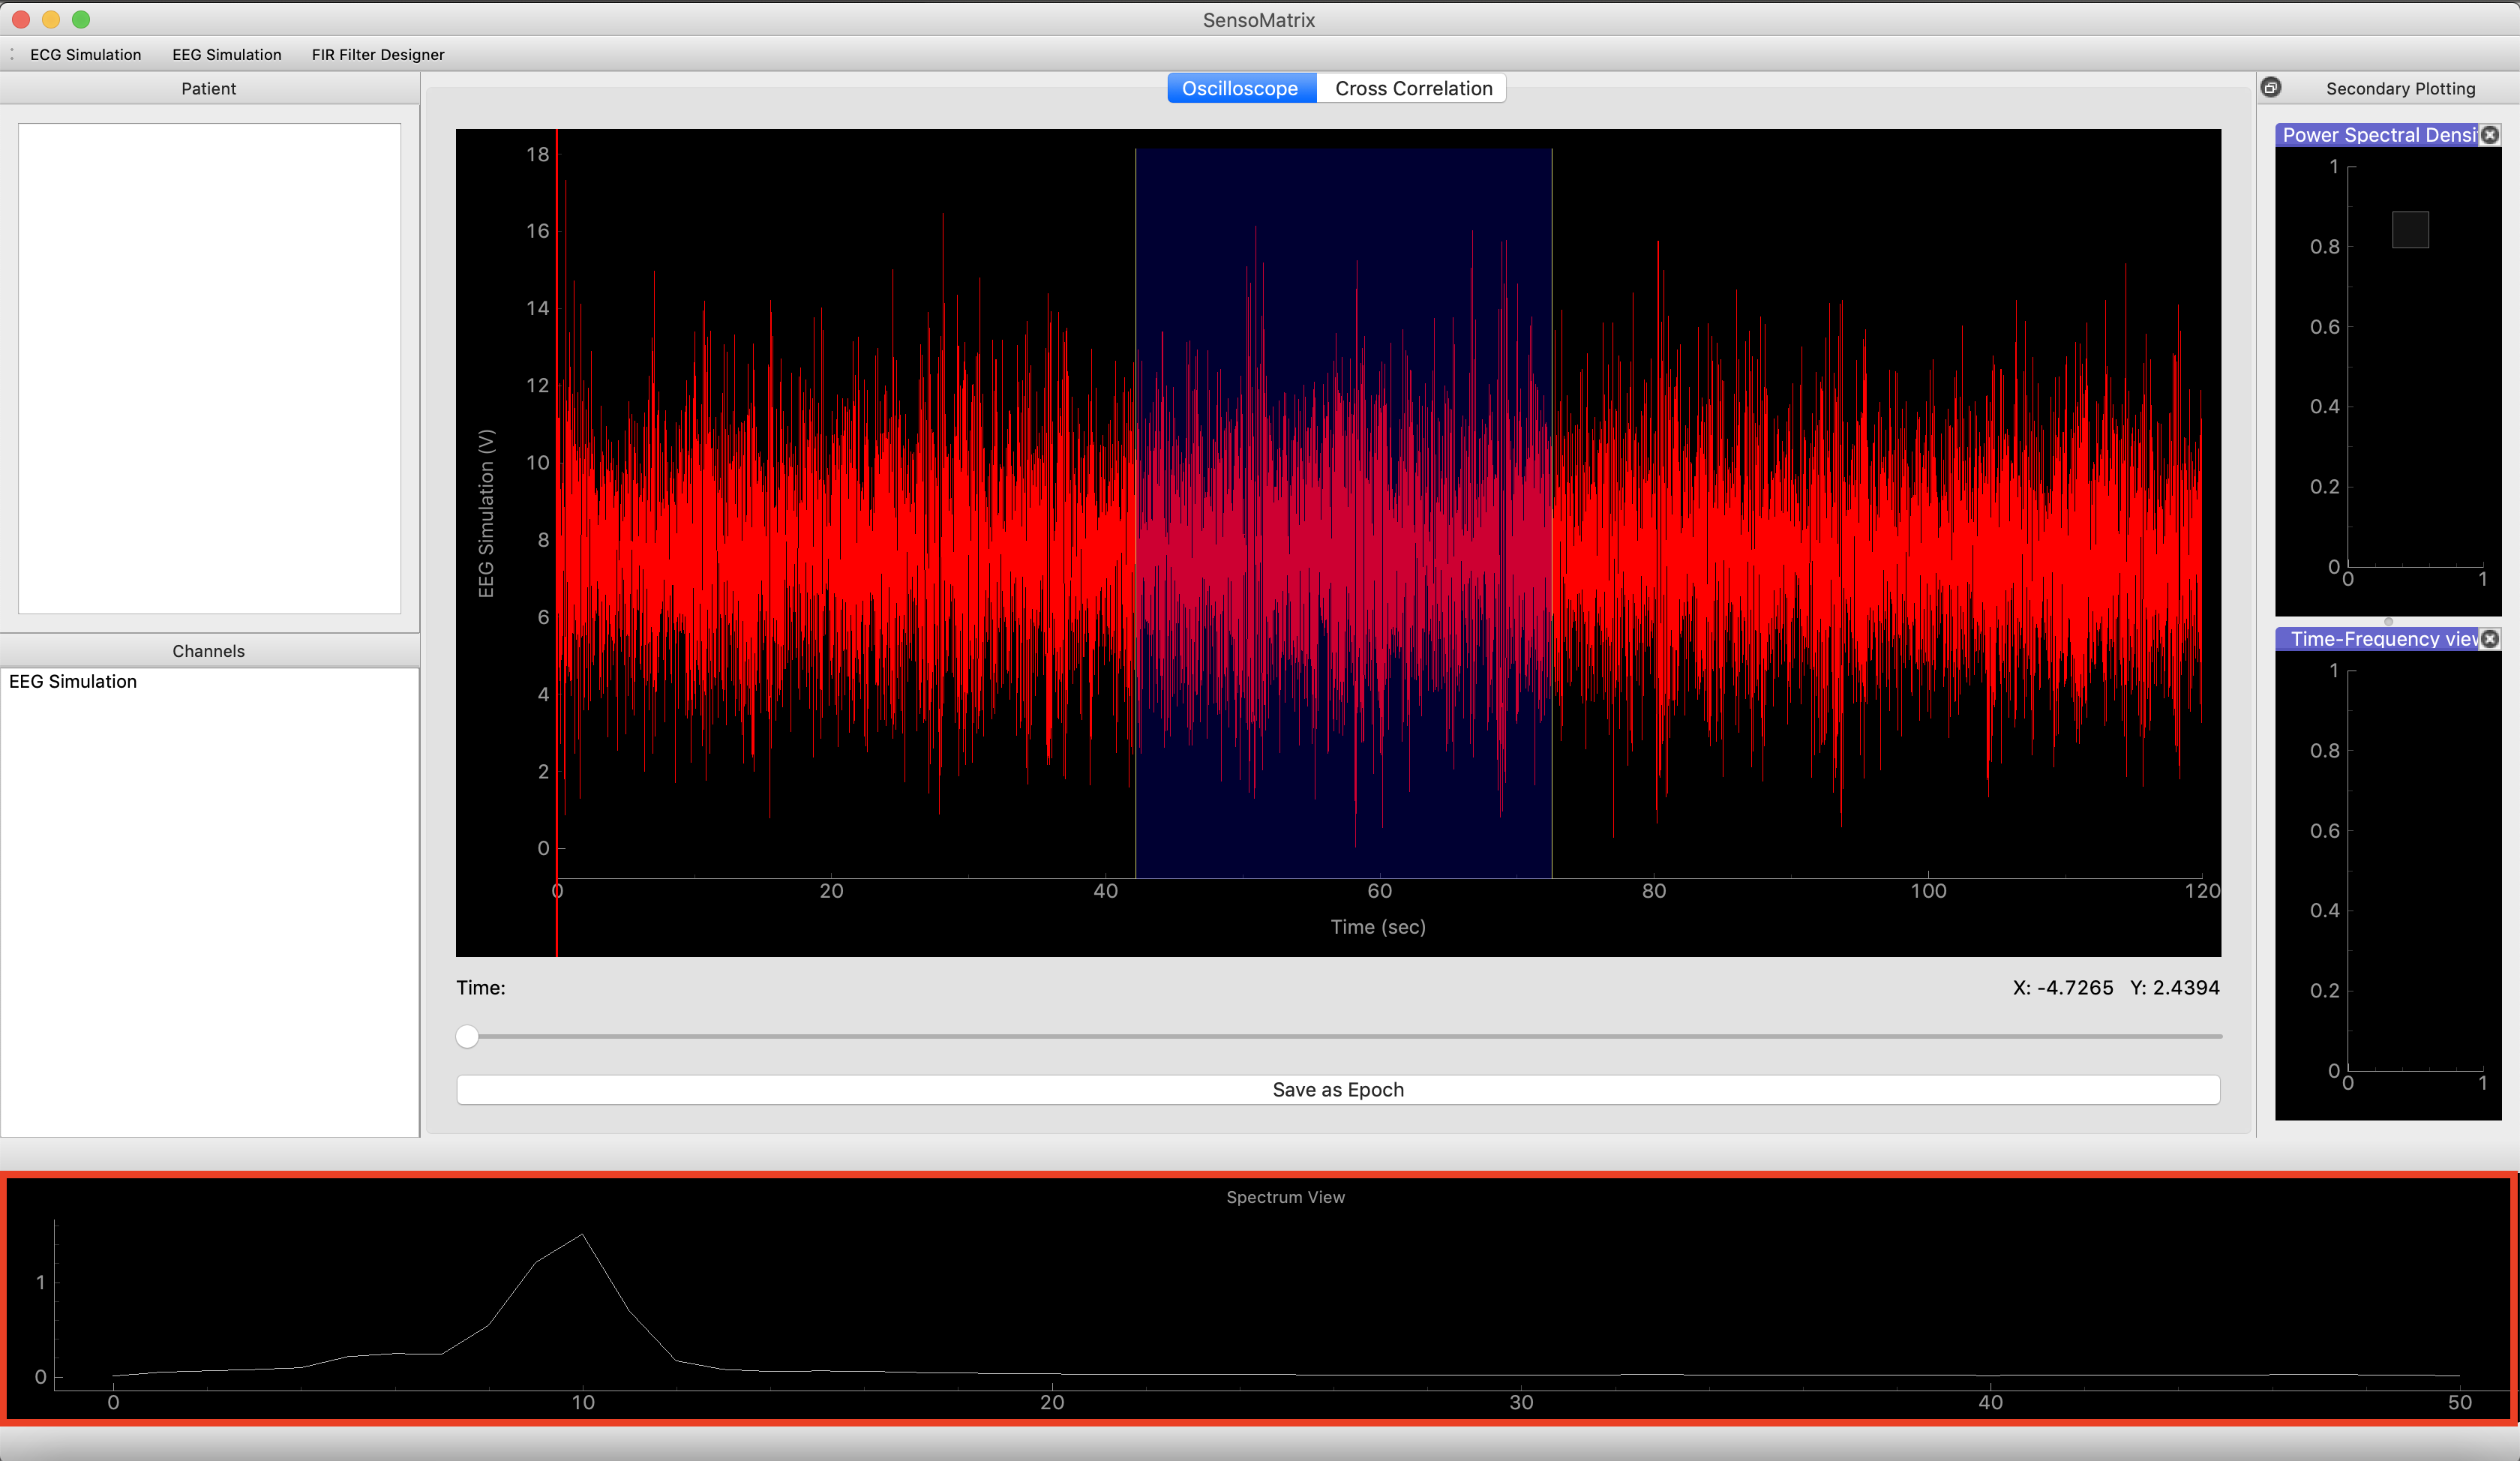
- The user may also have a spectrum view of the tagged window, by
looking at the spectrum view, which is located at the bottom of the
SensoMatrix window. Screenshot provided below:
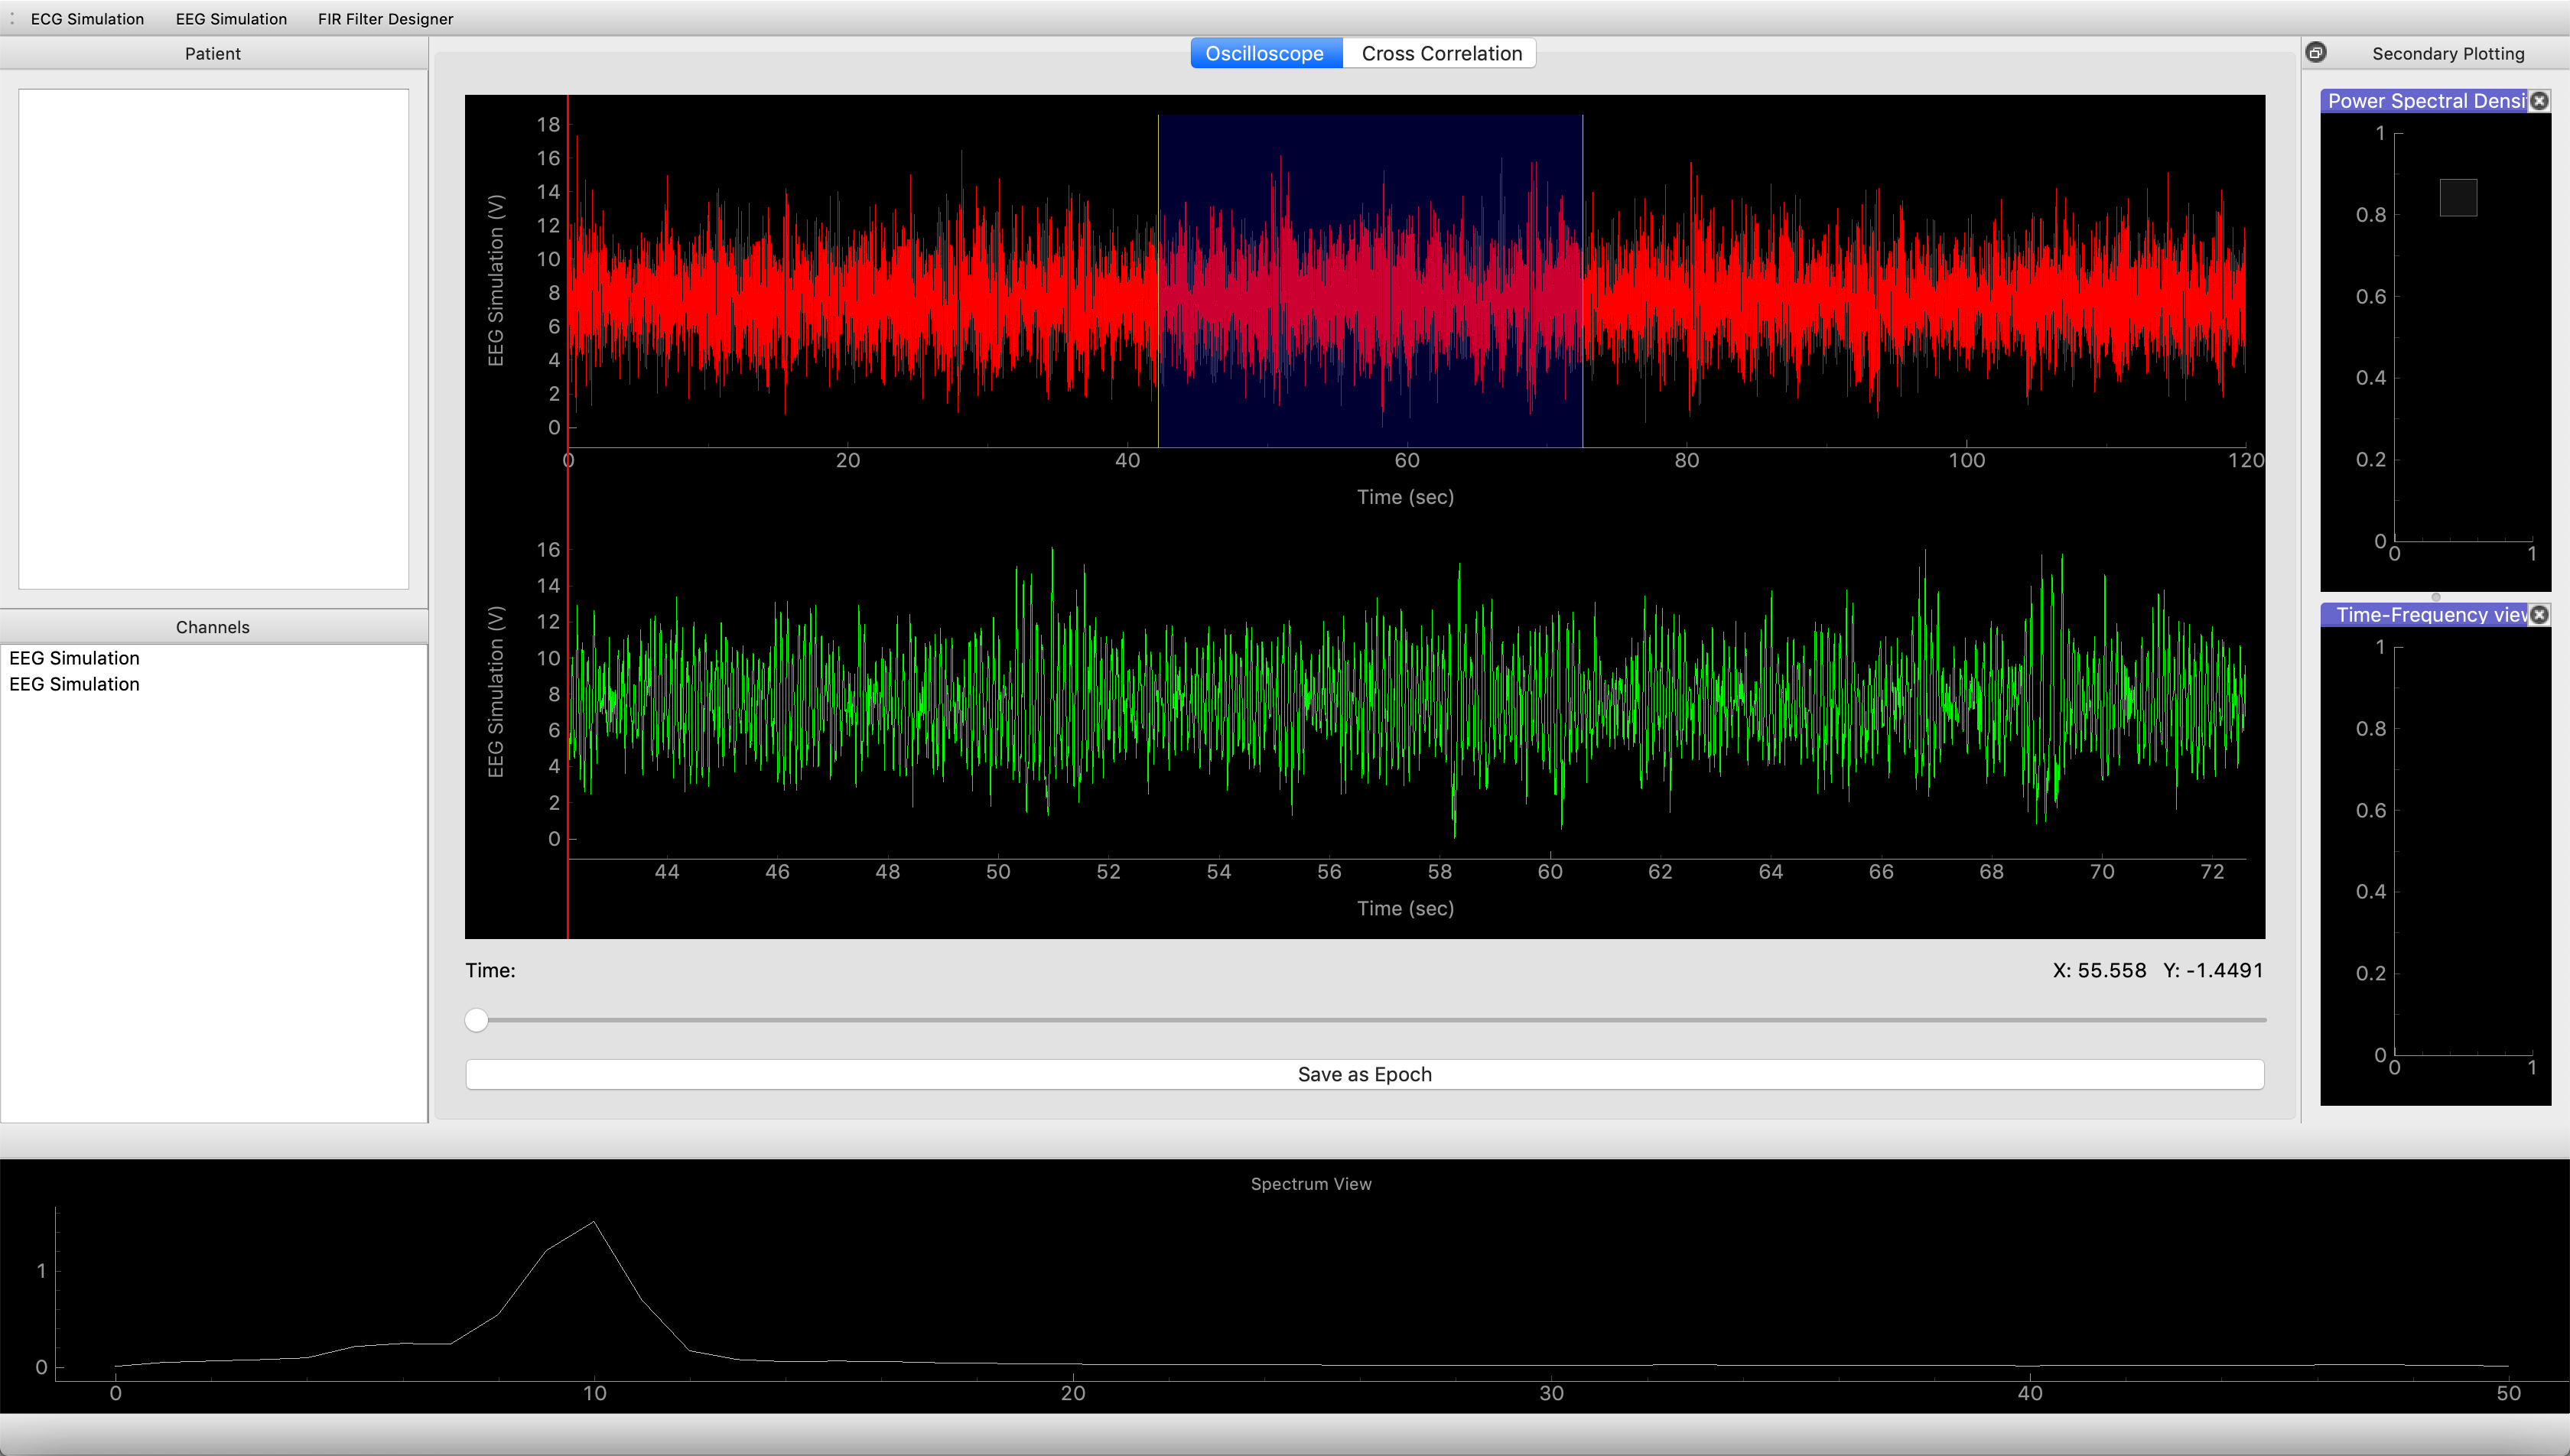
- The user can also further analyze the highlighted window, by saving
it as an epoch, by clicking on “Save as Epoch” located right below
the oscilloscope window. As a result, the user will see highlighted
portion of the signal being displayed underneath the original signal.
Screenshots provided below: